
DATA
Who Lives in Share Houses, by Area
Women-only houses, how much residents interact, residents from outside Japan, and how often events happen, aggregated by area.
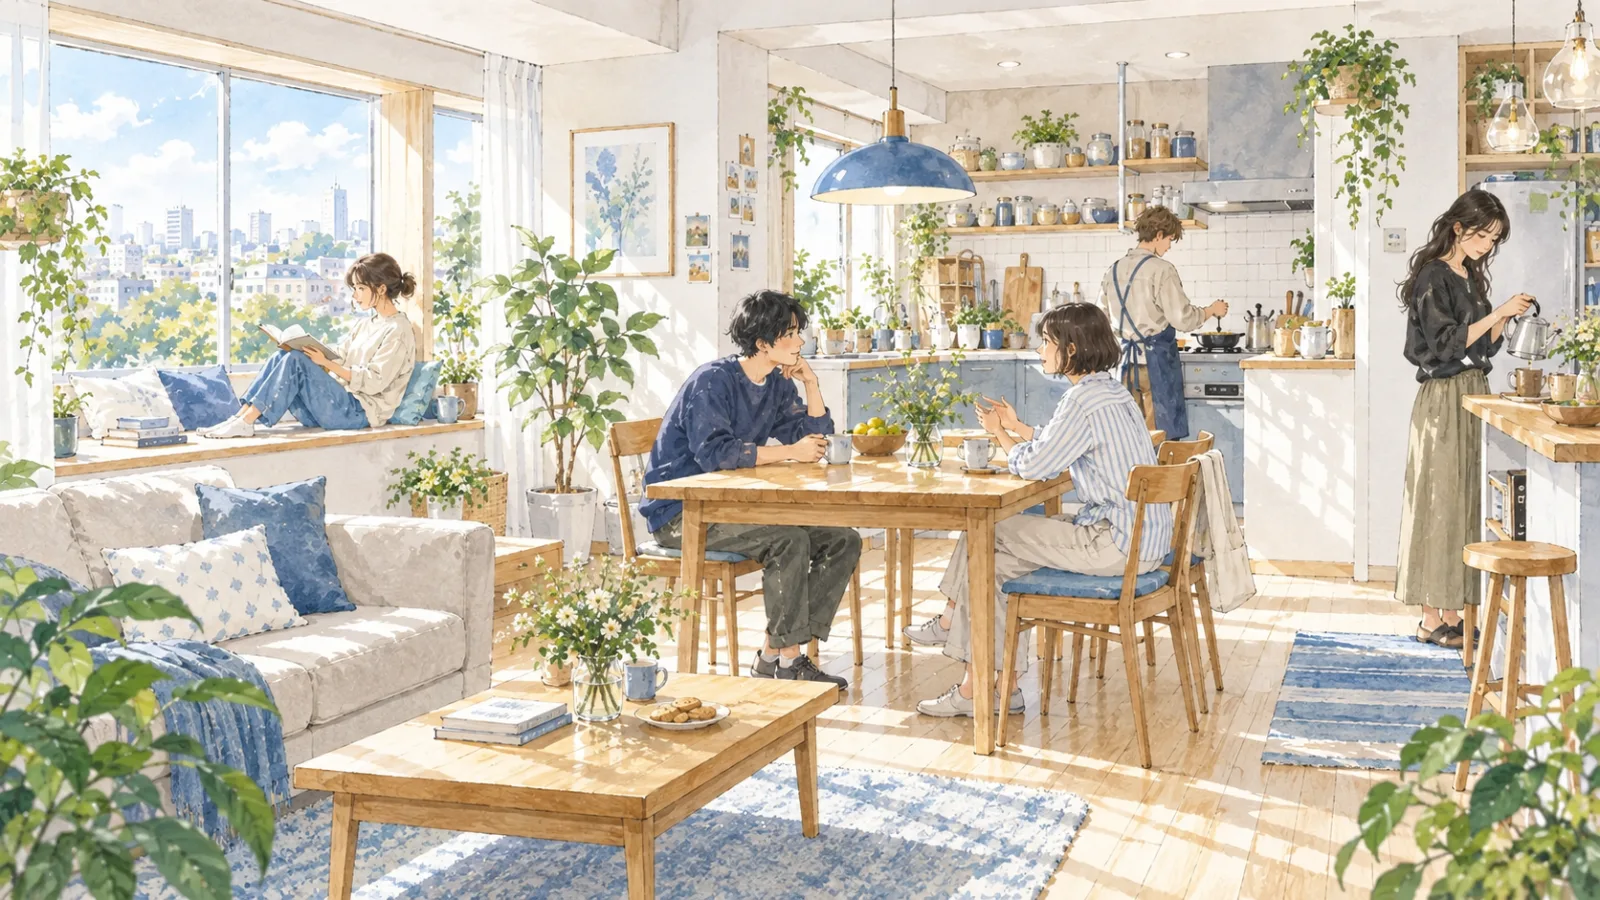
A share house is a room and a rent, and it is also a set of shared spaces where you run into other people. How much of that happens is the part hardest to picture from a listing page. The listing data holds four separate signals about it: whether a house is registered as women only, how much residents are said to interact, the share of residents who came from outside Japan, and how often the house holds events.
The charts below group those four registrations by area, and they answer four different questions. A figure from one of them does not stand in for another, so it is worth reading them next to each other rather than letting one bar settle your impression of what a house would be like to come home to.
Everything here is what the operator entered for the listing, not something we went and saw. Three of the four items are filled in by only some of the listings, so each chart is calculated among the listings that carry that item, and the number it counted is shown with it. Ages are not part of these charts. Residents move in and move out as well, which means a house can read one way in the data and feel different by the time you visit. The figures are recalculated each day from the listings published in English on Shareclip.
The numbers at a glance
- Women-only houses
- 33%
- Houses where almost everyone interacts
- 42%
- Houses where 30%+ came from outside Japan
- 68%
Of the houses listed on the share house site ShareClip, including those in our recommended placement slots, we count all 303 houses for whether they are women-only, 72 for how much residents interact, 78 for the share of residents from outside Japan, and 78 for how often events happen. Resident information is registered by each operator, and we calculate shares using only the houses that have registered the field.Data as of September 23, 2026, updated daily.
Share of women-only houses
Kansai / Chubu62%
Ikebukuro / Akabane / Nerima40%
Shibuya / Ebisu / Shimokitazawa39%
Shinagawa / Kamata / Omori33%
Ueno / Asakusa / Akihabara23%
Kanagawa19%
We leave out areas with fewer than 10 houses we can count (3 of them), because the figures move too much to read.
The bar shows the proportion of listings in each area registered as women only, and the dotted line is the proportion across all of them. Below every row you will find two counts: the listings included, and the listings among them registered as women only. Those say different things. A large proportion of a small group is not the same as a wide choice of houses, so read the proportion and the count together before you narrow a search to one area.
The registration itself describes who may live there and nothing else. It does not tell you how the entrance and room doors lock, how the bathrooms and the laundry are arranged, or what the rules are for visitors. Use the chart as a way into a search and settle those points on the listing page and in your questions to the operator.
How much residents interact
All listings72 houses
Kansai / Chubu30 houses
Kanagawa12 houses
We leave out areas with fewer than 10 houses with the interaction field registered (8 of them), because the figures move too much to read.
This stacked bar splits the registrations into three levels, running from greetings in passing, through a few residents who spend time together, to nearly everyone taking part. The row at the top covers all listings at once, and each area sits beneath it on the same scale, with the breakdown repeated in words under every row so you are never reading the colors alone.
A level was chosen by the operator at one moment, for the house as a whole. It makes no promise about the particular people who will be in the kitchen when you get home, and it can change with a couple of move-ins. At a viewing, ask when the shared rooms actually get used and how residents tend to arrange things between themselves, then decide whether that matches the distance you want to keep.
Residents from outside Japan
All listings78 houses
Kanagawa13 houses
Kansai / Chubu30 houses
We leave out areas with fewer than 10 houses with the field registered (8 of them), because the figures move too much to read.
This stacked bar divides listings by the share of residents who came from outside Japan, in the three steps the operator can register: none, below thirty percent, and thirty percent or above. All listings appear in the row at the top, and the areas follow on the same scale. The item moves whenever somebody moves in or out, so the registration you are reading can sit some way behind the present state of the house.
A proportion says nothing about which languages get spoken in the shared rooms, how people spend time there, or how the house runs its rules. If any of that matters to you, ask about it plainly: whether the house rules and the move-in guidance exist in more than one language, which language the operator uses for notices, and who you would contact when something needs fixing.
How often houses hold events
- None in particular20 houses (26%)
- Once every few months38 houses (49%)
- A few times a month18 houses (23%)
- Frequently2 houses (3%)
This chart counts listings inside each level of event frequency the operator registered. A listing sitting in the step for no regular events simply has nothing entered on that calendar. It is a statement about the schedule, not a sign that the residents keep to themselves, and plenty of shared living happens without anything being organized.
What counts as an event varies as much as how often one happens: a meal cooked together, a seasonal gathering, a cleaning day. Whether taking part is expected or entirely up to you varies too. Ask what has been held recently and how people join in. The answer is useful either way, whether you are hoping for a ready-made way to meet the others or for a house where nobody minds when you decline.
Reading the resident data
These charts describe areas, not houses. They cannot confirm who is living in a particular share house today, and they were never built to. When a listing holds your attention, take the questions to the operator: how many people are living there at the moment, when the shared rooms tend to be busy, and how notices that everyone needs are passed around.
There is no correct amount of contact with the people you live with. Someone who wants a kitchen full of company and someone who wants a quiet corner at the end of the day are both after a good fit, and both get there faster by naming the specific thing they need: a place to work undisturbed, events that stay optional, a shared room still usable late in the evening. Say it out loud while you are still choosing, and you will learn more in one conversation than any chart can tell you.
Questions people ask
- What does this data cover?
- We aggregate the registered data for the 303 houses listed on the share house site ShareClip, including those in our recommended placement slots. The figures on this page are as of September 23, 2026.
- Where does the resident information come from?
- Each operator registers it on ShareClip. For how much residents interact, the share of residents from outside Japan, and how often events happen, we use only the houses that have registered the field, and we show how many that is.
- Can I cite these figures?
- Yes, if you credit ShareReco (share-search.com) with the page URL and the date you looked. The figures change every day, so please include the date.
NEXT READ
You might also like
 TokyoPick an area by commute and days off
 Shinjuku, Nakano & KoenjiCompare lines and the walk home
 Women-onlyLocks, bathrooms and the walk home
 International householdsLanguage, rules and daily life